
Getting Started with HR Data Analytics
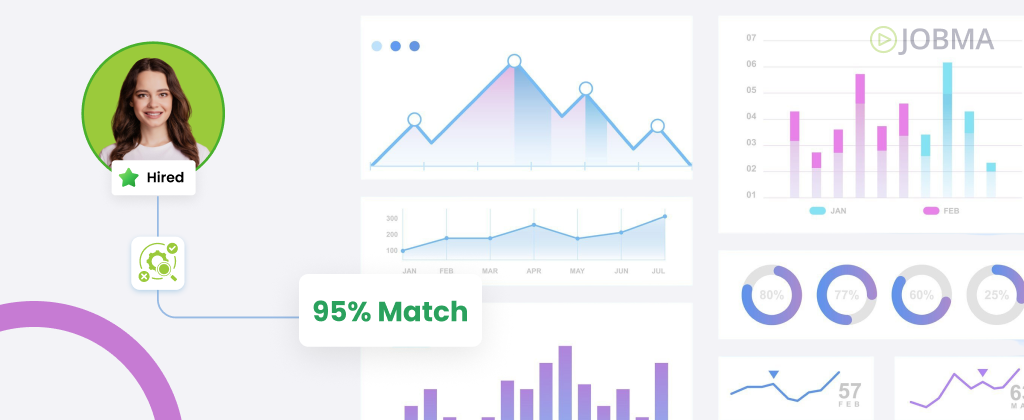
Strategy without data is just guesswork. As the role of HR is evolving, you’re expected to do more than just hire, manage, and support employees. You’re expected to drive strategy. That’s where HR data analytics comes in.
Every resume submitted, performance review completed, or exit interview recorded contributes to a growing stream of information. These touchpoints, when analyzed effectively, offer powerful insights into what’s working, what’s not, and where action is needed. The challenge is no longer just gathering this data, it’s knowing how to use it to make smarter, faster, and more impactful decisions. HR analytics gives teams the ability to identify patterns, predict outcomes, and measure the success of initiatives with clarity and confidence.
In this guide, we break down what HR data analytics is, which metrics matter, and how to put it into practice in your organization.
What is HR Data Analytics?
HR data analytics enables teams to gather, organize, and analyze human resources data. It aims to guide smarter decisions, tackle workforce challenges, and align HR activity with overall business goals. Where data meets people, raw data transforms into powerful insight.
Analytics allows for the application of statistical methods and tools to make sense of large sets of information. In the HR context, this means taking structured data, like hiring timelines, turnover trends, compensation records, and performance scores, and using it to answer practical questions that affect how people are hired, managed, and retained. Modern HR teams often complement this process with an ai agent service provider, which can automate data analysis and deliver actionable insights more efficiently.
At its essence, HR analytics helps answer pivotal questions like:
- How can we optimize recruitment strategies to improve the quality of hires?
- Why are employees leaving our organization?
- What drives high performance in our workforce?
To find answers to these questions, HR teams collect information from sources such as your Applicant Tracking System (ATS), hiring and assessment platforms, Human Resource Information Systems (HRIS), payroll records, performance reviews, engagement surveys, learning management systems, exit interviews, and more. This information can be both quantitative (like time-to-hire or absence days) and qualitative (such as open-ended survey responses or exit interview themes). For example, raw data may include resignation dates, tenure at exit, exit reasons selected in forms, and open-text responses from exit interviews.
Organizations track survey metrics rate to understand participation levels and ensure the insights they gather are truly representative.
When you organize structured information collected from credible sources using a PDF viewer, patterns emerge. By organizing and examining this data, HR professionals can identify patterns, such as early signs of burnout, recurring onboarding gaps, or mismatches between compensation and performance. For example, on organizing the exit interview data, you might notice that employees reporting to a particular manager have a 2x higher turnover rate, with exit interview themes repeatedly mentioning unclear role expectations and lack of feedback.
This isn’t just about tracking metrics, it’s about proactively shaping talent strategies – something modern HRMS Software Solutions help achieve by turning raw data into actionable insights. When you see the signals ahead of time, your approach shifts from being reactive to being proactive. Whether you’re tightening your recruitment funnel or building a data-informed culture, HR analytics turns instinct into insight and makes HR a strategic force in your organization. By moving HR data from MySQL to BigQuery, you can leverage powerful analytics at scale to uncover trends and drive smarter decisions.
Key Metrics in HR Analytics
Metrics are the engine of analytics. They translate employee behavior and workforce patterns into actionable signals. We’ve compiled some of the most valuable metrics for data-driven HR decision-making:
1. Cost-per-Hire
This metric gives you a pulse on recruitment efficiency and how you can optimize it while hiring quality candidates.
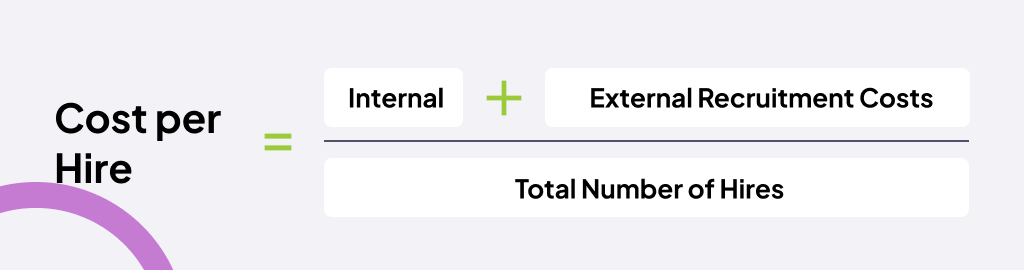
Formula:
Cost per Hire = (Internal + External Recruitment Costs) / Total Number of Hires
Why it matters:
If you spent $120,000 hiring 10 people, your cost per hire is $12,000. Now, monitor the performance of new hires. Were there cheaper but equally effective sources?
How to act on it:
Break down costs by source, separate spending on external agencies, job boards, employee referrals, and internal recruiters. Compare the cost of each source with performance data, like how many of those hires completed probation or received strong early reviews. This helps identify the sources that bring in quality candidates for the lowest cost.
2. Employee Turnover
Employee turnover tells you how many employees leave over a period and why. When segmented by department, role, or tenure, it can expose deep operational cracks.
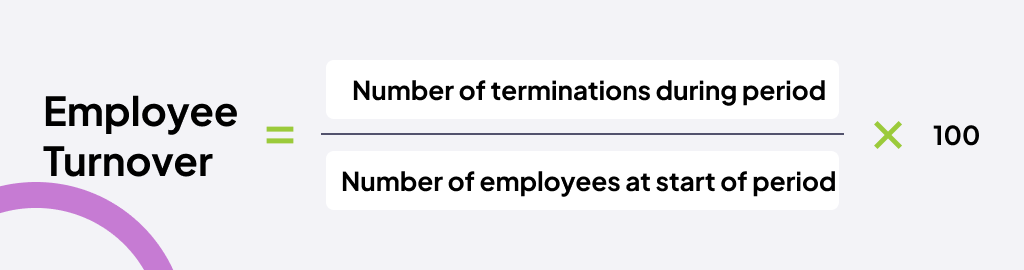
Formula:
Employee Turnover = (Number of terminations during period / Number of employees at start of period) x 100
Why it matters:
Let’s say your marketing team has a turnover rate of 28%, far above the company average. That signals something deeper, maybe weak leadership, lack of career growth, or unclear performance metrics. This data gives HR the chance to dig in, talk to teams, and design better retention strategies.
How to act on it:
Look at what employees said during their exit interviews, and see if they mention similar reasons. Also, the team’s engagement survey results might be worth looking at. If both data points indicate the same issue, set a clear goal. To address a lack of support or unclear expectations, your goal should be to reduce turnover in the marketing team by 15% over the next quarter. Devise a plan for improving onboarding or offering growth opportunities to support this goal. According to a Flow State Sales expert, a proper sales enablement process and sales training programs can help your organization to solve team low productivity issues and distractions.
3. Absenteeism Rate
Absenteeism is more than just “people not showing up”, it can be a red flag for dissatisfaction, poor leadership, burnout, or even toxic work environments.
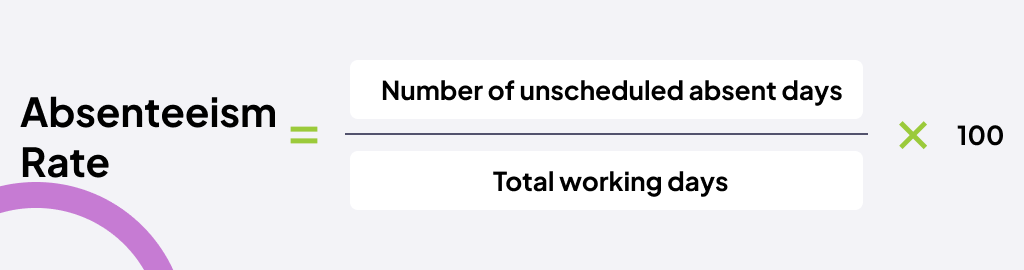
Formula:
Absenteeism Rate = (Number of unscheduled absent days / Total working days) x 100
Why it matters:
Imagine a support team where absenteeism jumps in Q2. You might find that a new shift schedule doesn’t align with personal needs, or a recent manager change caused morale dips. Without data, you’d never spot this in time.
How to act on it:
To understand what’s driving absenteeism, start by breaking down the data. Look at who’s missing work most often, by role, department, and manager. Compare this with other data that might explain why. If you track overtime hours or run workload surveys, look at those side by side. A team with high absenteeism and long overtime hours is likely dealing with burnout. Once you’ve identified where burnout might be happening, take action. Offer wellness programs, introduce flexible work policies, or launch manager training. Then monitor whether absenteeism declines in the next quarter.
4. Revenue Per Employee
This metric connects talent efficiency to business impact. It’s especially powerful when benchmarking productivity across time or departments.
Formula:
Revenue Per Employee = Total Revenue / Total Number of Employees
Why it matters:
Let’s say Company A and Company B both have 100 employees. But Company A generates 2x more revenue. HR analytics can help identify why, maybe it’s a leaner team structure, better tools, or a more experienced workforce.
How to act on it:
Start by tracking this data over time, monthly, quarterly, or annually. Once you have this data, look at how your talent investments have changed. Did you recently hire a lot of new employees? Launch a major training program? Change the way teams are structured? Check if they line up with any changes in revenue per employee. If you had increased headcount, but revenue per employee still fell, it may be time to optimize team composition or upskill current staff. This approach is essential for effective revenue enablement, ensuring that your workforce investments translate into real business growth.
How Data Analytics Improves HR Decision-Making
Grounding HR Strategy in Real Data
Analytics brings precision into HR processes by grounding decisions in actual trends and patterns drawn from your organization’s data. While experience matters, relying on subjective judgment alone is no longer sufficient, especially when the data is available to provide clarity. Investing in data modernization initiatives, such as moving data from PostgreSQL to BigQuery, can further enhance the quality and accessibility of HR data, enabling more accurate and timely decision-making.
Let’s say you’re noticing higher-than-usual attrition in a few departments. Without data, the assumption might be that employees are disengaged or dissatisfied with pay. But with analytics, you may discover that turnover is 30% higher in teams with irregular workload distribution or those without defined development plans.
In this way, analytics helps HR leaders move beyond surface-level observations. When every strategic decision, be it restructuring, upskilling, or adjusting benefits, is backed by data, it strengthens your case with stakeholders and improves the chances of achieving measurable impact.
Problem-Solving Through Real-Time Insight
With access to real-time dashboards and regularly updated workforce data, HR teams no longer need to wait for annual reviews or exit interviews to uncover problems. You may notice that absenteeism in the customer support team has jumped from 2% to 7% over the past two weeks. Or, three high-performing employees from the product team may have resigned within the same month.
These real-time signals act like early warning systems. Higher absenteeism could be a sign of burnout or low morale. Data enrichment allows HR to improve data collection, ensuring all relevant employee information is captured and analyzed. With this insight, HR can intervene early, facilitating manager coaching, rebalancing workloads, or initiating pulse surveys to learn more before the issue escalates.
Instead of reacting to turnover or disengagement after the damage is done, data analytics empowers HR to act with precision and speed. This ability to respond quickly and deliberately helps protect both team performance and employee morale, making HR a more agile, accountable partner in business outcomes.
Connecting Talent Data to Business Outcomes
HR analytics is a powerful tool to correlate people metrics with business performance. It’s not just about tracking who completed training or how long someone’s been in a role, it’s about understanding how these factors contribute to results like revenue growth, project delivery, customer satisfaction, retention and even strategic initiatives such as global expansion.
For example, you might discover that sales reps who complete product training within their first 90 days outperform their peers by 18%. These insights help you shift from being a support function to a strategic partner. The clarity from data-backed evidence allows you to replicate high-performing profiles in your hiring, refine learning and development programs, and make more targeted talent investments to support business growth.
How to Implement HR Data Analytics
Implementing HR analytics doesn’t require complex modeling or data science degrees. Start with a clarity of purpose, accessible tools, a structured framework, and leverage AI to connect business priorities with workforce insights.

Step 1: Frame the Business Question
Analytics must serve a clear purpose. How do you define that purpose? Before you even think about data sources or tools, sit down with key business stakeholders (e.g., Head of Sales, CEO, Operations Director) and ask:
- What specific business problem are we trying to solve using HR data? (e.g., ‘Why are we struggling to retain our top sales performers in the first two years?’)
- What critical business decision are we trying to inform or improve? (e.g., ‘Should we invest in a new leadership development program for middle managers?’)
- What behavior or outcome are we trying to influence, and how will that impact our business goals? (e.g., ‘How can we improve employee productivity in our customer service team by 10% to reduce operational costs?’)
Instead of vaguely asking, “Give me turnover data,” ask, “Our current sales conversion rate is 5% below target. We suspect this is linked to high first-year attrition among new sales hires. How can we use HR data to understand and reduce this first-year attrition in our sales teams, specifically focusing on its impact on our bottom line?” This sharpens your focus and ensures the analysis will deliver tangible business value.
Step 2: Form a Hypothesis
Once you have your core business question, formulate a working theory or hypothesis. It provides a direction for your data collection and analysis, preventing you from drowning in irrelevant data. It’s an educated guess about the potential cause of the problem or the likely solution.
For example, for the sales attrition problem, your hypothesis might be: “We hypothesize that new sales hires are leaving within their first year primarily due to inadequate initial sales training on our complex product line and a lack of timely, constructive feedback from their managers on performance.“
This hypothesis will guide which specific data points you need to collect (training completion records, performance review feedback, manager survey results, exit interview reasons) and how you will analyze them.
Step 3: Gather and Clean Your Data
This is often the most time-consuming but critical step. Here’s how you do it effectively:
- Identify Sources: Map out every single system where relevant data resides: your HRIS (for tenure, demographics), interview management system and ATS (for recruitment source, drop-offs, time-to-hire), payroll (for compensation history), performance management system (for review scores, feedback), and learning management system (for training completion). Leverage the AI capabilities of your systems to compile data from qualitative sources like exit interview notes or onboarding survey comments. Using AI CRM software can help centralize communication data, making it easier to integrate with other systems.
- Extract Data: This involves gathering reports from your AI-powered HR systems. For example, you can download a report generated by AI summarizing the details of candidates interviewing for a position, what their assessment rating and recommendation were, and whether the team closed the job position.
- Clean the Data:
- Ensure dates, job titles, and department names are consistent across all systems (e.g., ‘Sr. Engineer’ vs. ‘Senior Eng.’ vs.’Engineer, Senior’).
- Decide how to treat missing data points (e.g., impute with averages, flag as unknown, or exclude rows if critical).
- Ensure each employee or record appears only once.
- Fix typos, incorrect IDs, or illogical entries.
Step 4: Analyze Using AI
With clean, integrated data, you can now put your hypothesis to the test. This is where the patterns emerge, the assumptions are tested, and the groundwork is laid for actionable insights. These insights can help you shorten sales cycles by guiding faster, more informed decisions. Just as using a free essay shortener can help streamline long academic texts into concise versions without losing meaning, HR teams can use AI analytics tools such as Lumi AI to accelerate analysis, detect hidden patterns, and uncover insights that might otherwise be missed.
- Segment your data to move beyond averages and explore what’s happening in specific groups. Use AI segmentation features in HRM platforms to group employees by role, tenure, location, or department. This helps you quickly see patterns, like which teams are seeing higher turnover or which roles are consistently underperforming.
- Use correlation insights from HRM platforms to understand what’s influencing outcomes. For example, you might find that employees who complete onboarding within the first week are 30% more likely to stay for a year. That insight can validate and even prioritize onboarding investment.
- Track trends over time using auto-generated trend lines in tools like Power BI, BlazeSQL, or Tableau. These tools visualize metrics like absenteeism or engagement scores, so you can see whether things are getting better, worse, or staying the same.
- Ask plain questions like “Which department has the highest attrition?” using natural language query tools in Power BI Q&A. The AI will return a ready-to-use chart or summary, saving you from building reports manually.
Step 5: Communicate Insights Clearly
Analysis is incomplete if its insights aren’t effectively communicated to decision-makers.
Speak in clear, business-focused language, not technical or statistical terms. Emphasize the “so what?”, how the insights affect revenue, costs, productivity, or strategic goals. Present findings differently for senior leadership by focusing on strategy and ROI, for department heads by focusing on team-level impacts, actionable solutions, and for HR business partners by focusing on implementation steps.
So, instead of saying “Our regression analysis shows a statistically significant inverse correlation (p < 0.01) between training completion and voluntary separation rates among new sales associates,” say, “Our data reveals a direct link, new sales hires who do not complete their full product training within the first month are 40% more likely to leave in their first year, costing us approximately $150,000 in replacement costs last quarter alone.“
Create interactive dashboards that allow users to drill down into data, showing key metrics and trends at a glance. For executive summaries, create infographics that highlight key insights and recommendations without overwhelming detail. Many AI tools (like AI-powered interviewing tools) also offer automated reporting features, which help generate charts, summaries, and tailored reports for different stakeholders with just a few clicks.
Step 6: Execute, Monitor, and Refine
HR analytics doesn’t stop at insight. The value lies in how you turn it into action, measure impact, and refine continuously.
Once you’ve identified the problem, say, high first-year attrition in one department or lower engagement in a specific region, use AI-powered task managers to create and assign action plans. These tools can suggest follow-up actions based on flagged issues and design specific, achievable recommendations.
How to make them actionable:
- Be direct: Swap vague suggestions with focused tactics, like ‘Improve onboarding’ becomes ‘Add job-specific simulations in week one.’
- Quantify outcomes: Set clear and measurable objectives, like ‘Target a 10% reduction in attrition over 6 months.’
- Connect to KPIs: Each action should link to a measurable HR or business goal like employee attendance, time-to-hire, or turnover.
Once your recommendations are ready, implement them immediately through your AI HR data analytics system with a clear deadline. At the same time, integrate the approval app to submit these proposals, ensuring that all decisions receive the approval of relevant leaders or teams, and can be advanced in a timely manner. You can also integrate sales engagement software to streamline outreach, automate follow-ups, and enhance communication with stakeholders throughout the HR cycle. Then monitor results:
- Use dashboards to track attrition, feedback scores, or onboarding completion.
- Review data weekly or monthly.
- Anchor data to achieve your goals.
Modern HR analytics is no longer about working harder, it’s about working smarter with the help of AI. When combined with business insight and execution, it becomes one of the most powerful tools in HR’s playbook.
Looking Ahead
HR data analytics is a necessary shift in how organizations manage people and performance, allowing companies to make data-driven decisions about hiring, retention, productivity, and workforce planning. Professionals who want to build these skills often enroll in a data analytics course online from H2K Infosys, where they learn how to analyze HR datasets, identify trends, and turn employee data into actionable business insights. Whether you’re trying to improve retention, streamline hiring, or shape a more engaged workforce, data offers a way to act with clarity and purpose. But the real power of analytics lies not just in collecting information, but in leveraging the right technology, asking the right questions, drawing the right insights, and turning them into decisions that move the business forward.
As HR continues to evolve from a support function to a strategic partner, the ability to turn workforce data into decisions will separate teams that simply operate from those that drive change.